Select Harvest Water Cost Risks

Select Harvest Water Cost Risks
Limitations
One notable limitation of my research was the accounting and reporting practices used by
Select Harvest. As you can see from the chart below, when simply multiplying the number
of almonds sold by the almond price, it did not always sync up to the reported revenue value
for the Almond division. As a result, some of the unit economics of this company is difficult to
confirm with certainty.
Identifying Water Usage
SHV has reported its water policy, which is acquired from the following sources:
⅓ Permanent water entitlement
⅓ Water leases (long-term leases from irrigators)
⅓ Water Spot market
In the Select Harvests 2017 Sustainability report, it was disclosed that the company
used 77,800 ML of water. This equates to 10.8 ML per hectare and 34.24 ML per acre for 2017.
Assuming the amount of water used per acre is the same over time, SHV will require roughly
79GL for 2019’s harvest (10.1 Per Hectare * 7,696.00 Hectares).
Which directly impacts the amount Select Harvests needs to buy on the market.
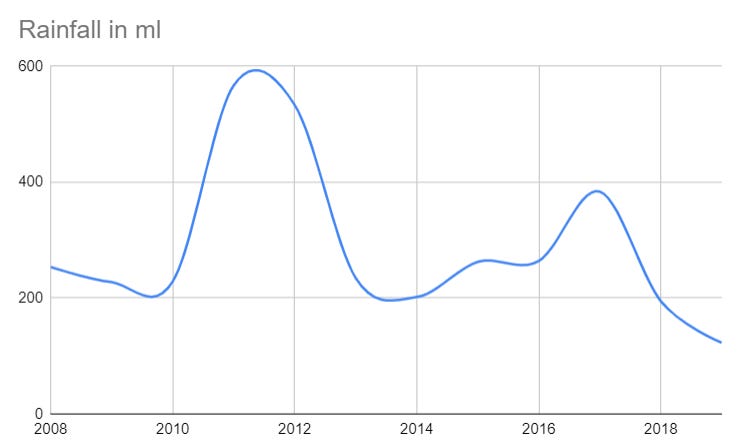
As a result, taking into account this year’s rainfall of 123 ml, and negate that from the water
usage needed for this year, the leftover ML needed from the market is 68,534 ML.
Water & CoGS
As rainfall increases, the need for water from the market decreases and thus the cost of goods
for the company also decreases. Below is a test of this hypothesis.
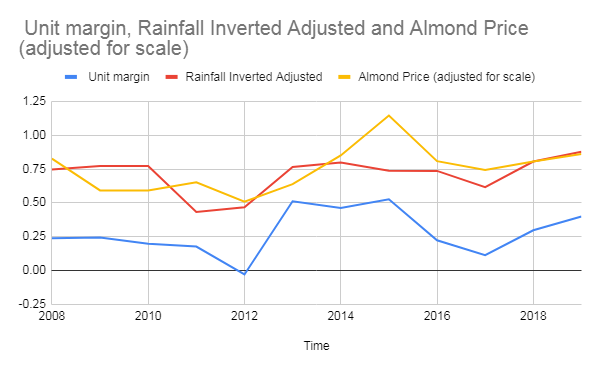
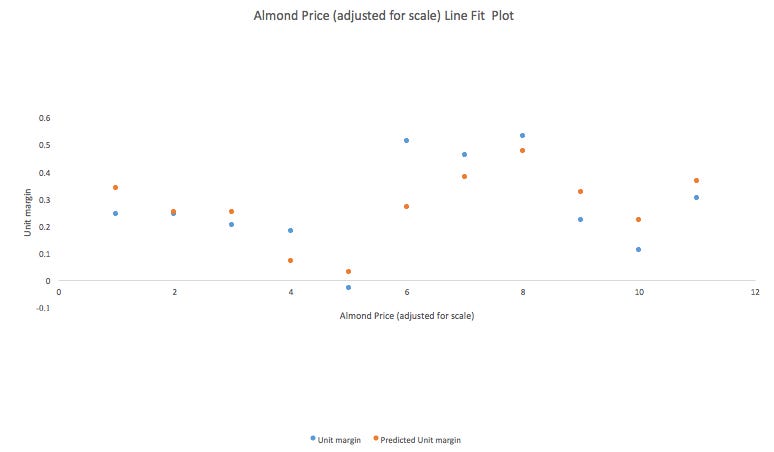
Rainfall and almond prices have a meaningful impact on the company's margins. Water prices
and almond prices impacted 60% of the movements of the almond division’s margins. This data
point reinforces the trend of water prices and rainfall impacting previous margins, to then make
the extension of using said logic in future years is as a reasonable assumption.
Permanent Water Rights
Using the sustainability report which was only released in 2017, it was discovered that they
used 77 GL of water. Taking into account their water policy, this leads to approximately 22 GL
of permanent water allocations.
Using information from the 2018 & 2019 Annual Reports, their permanent water allocation can
also, be calculated as follows:
Year
Valuation at
Current Market ($ m)
Historical ($ m)
Simple Calculated
Perm. Water (ML)
Land Weighted
Perm. Water (ML)
2019
85.8
37.9
13071.19
13870.71
2018
51.6
31.7
15052.63
13191.65
Sources: SHV Annual Report 2018, Page 61 ,
SHV Annual Report 2019, Page 62
The ‘Simple Calculated Perm. Water’ represents the amount of water they would hold, using an
average of the water costs across regions, while the ‘Land Weighted Perm. Water (ML)’ calculates the water
required for each region, weighted by the percentage of farms within that water trading zone
(shown below).
Percentage of Farms per Water Trading Region
NSW Murray below Barmah Choke
25.57%
Vic Murray from Barmah Choke to SA Border
28.33%
South Australian Murray*
20.72%
Murrumbidgee
25.38%
Source: https://selectharvests.com.au/geographic-diversity/
To figure out their water holdings, information from the annual reports from the years 2009 to 2019
were used to recreate the permanent water allocation. This was done by using 2009 permanent
allocation prices to create an initial estimate of the current allocation held, and then each subsequent
year calculating the amount of water bought, weighted to each water trading region using the above
proportions.

Reverse engineering water cost
In the full year 2019 presentation, SHV reported spending an extra 3 million on water costs,
a 54% increase on last years cost. costs roughly $9.5 million.
In the earnings call for that period, it was stated that water costs were roughly 11% of CoGS.
This would readjust the cost to $12.32 million. Select Harvests has had to use roughly 77,992.55 ML
of water in 2019, had 123ML of rain, this means they had to get 68,400ML from the market
(leased, spot and permanent). Minus 21,000 ML (very conservative estimates) from water costs
expensed via investing cash flows over the years. It is important to note that since Select Harvests
bought a lot of permanent and they spent between $9.5 million, and $12.3 million, the dollar cost
average per ML was $200 and $261 respectively. Obviously, this is the cost of not evenly spread
amongst the two streams, leased and spot prices, but to have an average between $200-250
it means a significantly lower spot price than the current on the market. In the event of half of the
water cost $800 and the other half costing $200, the dollar cost average would be $500, an
increase greater than 100%. As a result, this would increase water costs to $19 million, and $24
million respectively based on the reporting.
History
Select Harvests has faced a similar water season before, 2008. During this time the stock tanked,
however, this leaves the question: Is this time different?
If we examine permanent licenses, rainfall, and spot prices, we can see where 2019 is in relation
to 2008.
In 2009 the cost of water per acre was revealed in the annual report. We can use this as a benchmark
for what could be in the next quarter’s results. In 2008, Select encountered massive spot water costs,
which severely impacted the stock price. Average spot cost per ML was $900 and it cost Select
Harvests $1,680 per acre. Additionally, in 2009 spot cost was $690 per acre and a spot price of $300.
By contrast in 2019, the average spot cost by the end of 2019 was $800 but only spent ~$800
per acre, which implies they only spent ~$225 on spot.
By contrast, Select Harvests had almost no permanent entitlements compared to their total
acreage in 2008 and as a result, Select Harvests has a 25% free buffer (from an accounting
point of view due to the investing cash flows) from water costs via their permanent allocations.
Conclusion
Hopefully, this article has been a good primer into the some of the lesser pronounced risks with
Agricultural stocks, in particular Select Harvest. As water prices have come down in the last month,
water price risk is far less parlous than earlier this year.